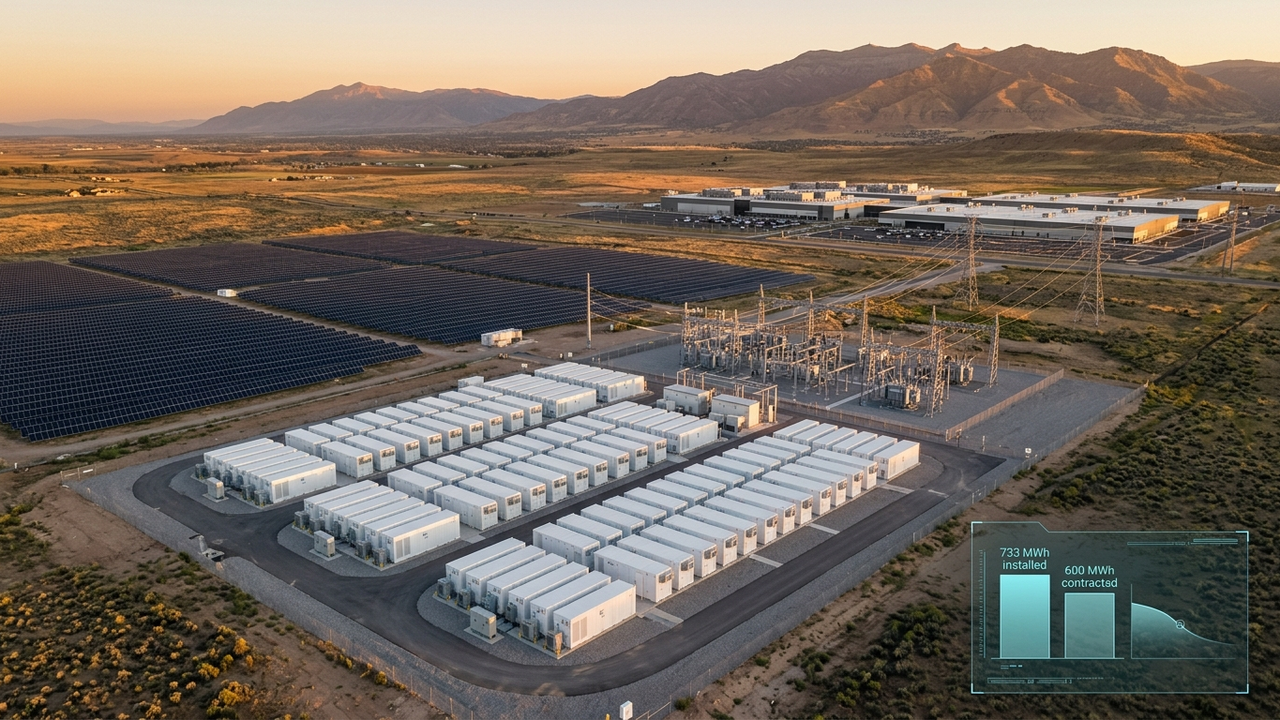
In February the Utah battery was 733 MWh. In November it is 600 MWh. Nobody removed a single cell.
On November 10, 2026, Lydian Energy said its Faraday BESS in Utah County is in commercial operation: 150 MW / 600 MWh, four-hour lithium iron phosphate (LFP), contracted to PacifiCorp and, under Rocky Mountain Power's Schedule 34 tariff, supporting Meta's Eagle Mountain data center (Energy-Storage.News, ESS News). Both reports note that Lydian's February financing announcement described the same Phase 1 as 150 MW / 733 MWh.
Lydian has not explained the gap publicly, so treat the cause as unconfirmed. But a 22% difference between two capacity numbers for one battery is exactly what BESS overbuild looks like: the gap between the energy you install and the energy you sign a contract to deliver. Here is the math engineers use to size it.
1. Installed vs. Contracted Energy: The 1.22 Ratio
Start with the two published numbers.
Ratio = 733 MWh / 600 MWh = 1.22
A grid contract is written at the point of interconnection (POI), in AC energy, for the whole contract life. A battery nameplate is usually DC energy at beginning of life. Every loss and every year of fade sits between those two numbers, so a developer installs more DC energy than the contract promises. If 733 MWh is a DC beginning-of-life figure and 600 MWh is the contracted AC figure, the ratio of 1.22 is the overbuild. That reading is our interpretation, not a statement from Lydian. Our earlier post on BESS duration and the MW-vs-MWh math covers why the 4-hour rating matters in the first place.
2. The BESS Loss Chain From Cell to POI
The energy that reaches the grid is the DC energy, multiplied by the usable state-of-charge (SOC) window and by every efficiency on the discharge path.
Example values (illustrative, not Faraday data):
DoD 0.95, η_PCS 0.96, η_MV 0.99, η_GSU 0.995
η_path = 0.96 × 0.99 × 0.995 = 0.946
E_POI = 733 × 0.95 × 0.946 ≈ 659 MWh
With those example values, a fresh 733 MWh system delivers about 659 MWh at the POI. That is roughly 10% above the 600 MWh contract on day one. That 10% is the margin that has to cover capacity fade, and auxiliary loads such as HVAC that we left out here.
3. LFP Degradation Math: Overbuild or Augmentation
How long does a 10% margin last? Model capacity fade as a fixed yearly rate, then solve for the year the delivered energy hits the contract.
Need: 659 × SOH(n) ≥ 600 → SOH ≥ 0.911
With f = 2%/yr (example): n = ln(0.911) / ln(0.98) ≈ 4.6 years
No-augmentation sizing to an 80% SOH floor:
E_DC = 600 / (0.95 × 0.946 × 0.80) ≈ 835 MWh
So there are two strategies. You can overbuild once, installing roughly 835 MWh up front so the plant never drops below 600 MWh before it reaches 80% state of health. Or you can install a smaller overbuild and augment, adding containers every few years as the cells fade. Under these example assumptions, 733 MWh sits between the two, which is consistent with an augmentation plan. Real fade depends on cycles per day, average SOC and cell temperature. At one full cycle a day, the battery sees 365 cycles a year and about 7,300 cycles in 20 years, so the cell's cycle-life rating at that depth of discharge matters a great deal. For the chemistry side of why grid batteries are almost all LFP now, see our video The Ultimate EV Battery Guide: NMC vs. LFP Explained.
4. Shared Substation Math: 525 MW Solar Plus 525 MW Storage
Faraday BESS sits on about 8 acres next to Lydian's 525 MW Faraday solar plant and shares its substation and interconnection. Phase 2 adds up to 375 MW / 1,500 MWh, targeted for Q4 2028. Add the two battery phases and you get 150 + 375 = 525 MW, the same figure as the solar plant. Whether that match is deliberate is not public.
Charge energy needed (RTE 0.86, example):
Phase 1: 600 / 0.86 ≈ 698 MWh
Phase 1 + 2: 2,100 / 0.86 ≈ 2,442 MWh per full daily cycle
Solar daily energy (capacity factor 0.27, example):
525 MW × 24 h × 0.27 ≈ 3,402 MWh
Share stored: 2,442 / 3,402 ≈ 72%
If both phases charged only from the neighboring solar plant, they could absorb roughly 70% of an average day's solar output under these assumptions. That is why storage on a shared substation is powerful for a data center contract. Midday solar that would hit the POI limit gets shifted into the evening, when the data center is still running and the sun is gone. The binding constraint becomes the POI's MW limit, not the MWh. A battery charging from on-site solar adds no export at the moment it charges, so a shared interconnection can carry far more energy per year than the solar plant alone. For the faster, second-scale job batteries do inside AI data centers, read AI Power Smoothing Explained.
- Why Phase 1 changed from 733 MWh (February) to 600 MWh (November). DC-vs-AC overbuild is our interpretation; Lydian has not confirmed it.
- The commercial operation date. ESS News reports operation since September 18, 2026, while the announcement came on November 10.
- The substation's POI limit, the plant's real round-trip efficiency and degradation rate, and the solar capacity factor. All the efficiency, fade and capacity-factor values above are illustrative.
- Meta Eagle Mountain's actual load and how much of this battery's output is matched to it under Schedule 34.
The Engineering Takeaway on BESS Overbuild
- Ask where and when. Every BESS capacity figure needs two tags: DC or AC at the POI, and beginning of life or end of contract.
- Overbuild is a degradation budget. A 1.2× ratio buys only a few years of fade margin at typical LFP fade rates, so plan augmentation or install more up front.
- Shared interconnection changes the economics. Pairing 4-hour storage with solar behind one substation turns a midday MW limit into evening MWh for a data center.
- Speed is now a spec. Lydian reports about ten months from mobilization to commercial operation, which is why data center buyers are signing for storage rather than waiting for new generation.
Sources: Energy-Storage.News (Nov 11, 2026); ESS News (Nov 12, 2026). Calculations by The Engineering Core using the illustrative assumptions stated above.


